2026 AI Sovereign Stack: The $500B Tax on National Pride

An infographic comparing 'Global Hyperscale' and 'Sovereign AI Stack' in 2026, showing a 42% TCO penalty for digital autonomy, alongside efficiency gaps in energy PUE, model latency, and talent costs, and an 'Investment Strategy' chart.

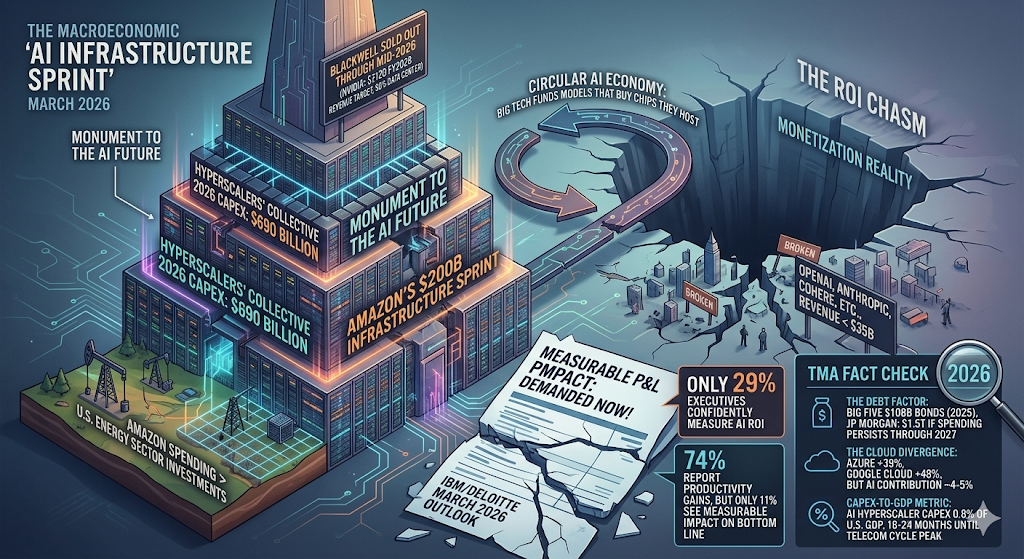
Sovereign AI is the 2026 geopolitical weapon. Discover the brutal TCO of national digital autonomy and why NVIDIA remains the ultimate winner. “Beyond the policy buzzwords, Sovereign AI has become a $500B friction in the global macro landscape.” Executive Summary: Sovereign AI has shifted from …

Read More

HBM4 Thermal Redline: Why 2026 AI ROI Depends on Cooling

A vertical infographic comparing HBM4 yields. Left: TSMC CoWoS with 70% yield. Right: Samsung NCF with 62% yield. Includes graphs and Summary.

HBM4 is hitting a physical wall. Discover how the Thermal Redline and Hybrid Bonding failures are reshaping the 2026 AI investment landscape. Don’t ignore the heat. The HBM4 Thermal Redline: Why 2026 AI ROI Lives or Dies by the Micro-Degree Executive Summary: HBM4 has officially …

Read More

$30,000 Per Wafer: The 2nm High-NA EUV Cost Crisis 2026

An infographic analyzing the 2026 semiconductor landscape, comparing 2nm foundry yields for TSMC, Intel, and Samsung, the cost shock of High-NA EUV, and the end of Moore’s Law economics.

2nm wafer prices are hitting $30,000. Is High-NA EUV an economic trap? Analysis of 2026 foundry yields, Intel 18A, and the death of Moore’s Law. The semiconductor industry is hitting a “Price Wall.” While the technical community celebrates the deployment of ASML’s High-NA EUV (EXE:5000) …

Read More

2nm Yield Rates 2026: Why TSMC is Starving the Market

A detailed economic infographic comparing two strategies for the 2026 HBM4 market: Player A focused on aggressive expansion and market share, and Player B focused on yield optimization and long-term TCO savings, featuring data charts, timelines, and macroeconomic impact analysis.

Is the 2nm transition a trap? In 2026, TSMC’s 70% yield dominance is creating a supply chain schism. Discover why Intel 18A and Samsung are struggling to keep up. 2nm yield rates 2026 analysis shows that the semiconductor industry has hit its most expensive wall …

Read More

NPU Yield Crisis 2026: Why Edge AI is Killing Margins

Infographic explaining the NPU Yield Crisis 2026. Visualizes sub-50% 3nm NPU yield, exponential yield loss from large die sizes, and the resulting inversion where Edge AI TCO ($0.15/1k Tokens) eclipses Cloud AI Cost ($0.08/1k Tokens). Source: techmacroarchive.com

The NPU Yield Crisis 2026 is here. Discover why sub-50% 3nm NPU Yield and exploding Edge AI TCO are making Cloud AI cheaper than local hardware. The NPU Yield Crisis: Why On-Device AI is 2026’s Biggest Margin Killer The marketing promise of 2026 was supposed …

Read More