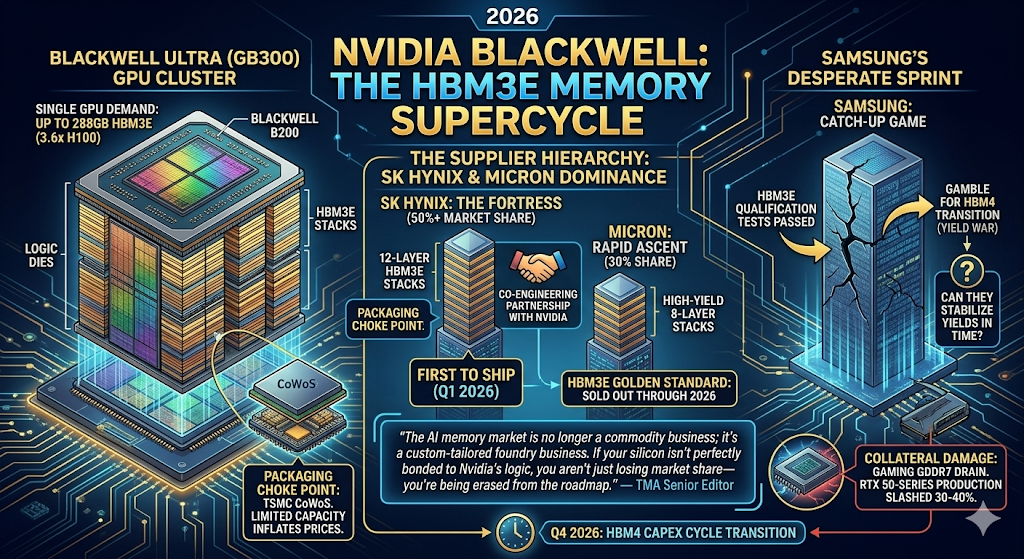
HBM Yield 2026: The Secret Bottleneck in NVIDIA’s Supply Chain

A professional 3D infographic analyzing the 2026 HBM4 yield crisis. It compares SK Hynix's 70-75% yield advantage via MR-MUF tech against Samsung's 50% yield friction. Features charts showing the 'Hardware Inflation Cycle' where declining yields lead to increased costs per FLOP, potentially cooling the AI ROI narrative. Source: techmacroarchive.com

Why HBM Yield is the New “Oil” for NVIDIA: 2026 AI Memory Market Friction The market operates on a dangerous assumption: that silicon production is infinite. In 2026, the AI narrative is colliding with a brutal physical reality—High Bandwidth Memory (HBM) yield rates. While hyperscalers …

Read More

AI Infrastructure Energy Arbitrage: The New Gold Rush of 2026

An infographic comparing traditional grid-tied data centers with the new 'AI Infrastructure Energy Arbitrage' model, featuring cost data, structural differences, and 2026 ROI projections.Big Tech AI Capex ROI Analysis 2026

As the $720B AI bet hits the power wall, ‘Energy Arbitrage’ becomes the only metric for ROI. Discover why raw compute is dead without cheap electrons. The $720 billion hardware gamble is currently colliding with the physical reality of a decaying global power grid, rendering …

Read More

The 1GW Power Wall: Why AI’s TCO is Exploding in 2026

A detailed data-driven infographic illustration analyzing the '2026 AI TCO Explosion: The 1GW Power Wall'. It compares globalized supply chains vs Sovereign AI models, breaking down manufacturing yield, datacenter capex, energy overhead, total cost of ownership (TCO) increase, and critical infrastructure penalties. Features fractured energy grids, liquid cooling, and 1GW scale conundrums.

In 2026, AI scaling hits the 1GW Power Wall. Beyond GPU specs, the soaring TCO of energy is the silent killer of Sovereign AI dreams. Stop obsessing over FLOPS. In 2026, the only metric that matters is Mega-Watts. The industry spent years bragging about model …

Read More